April 27, 2025
Telemetry-Driven AIOps: Engineering Self-Healing Systems
How to transition from reactive monitoring to proactive AIOps using OpenTelemetry and automated anomaly remediation pipelines.
The Problem
Enterprise systems generate millions of logs, metrics, and traces per minute. Traditional monitoring relies on static thresholds (e.g., “Alert if CPU > 90%”). In a dynamic, cloud-native microservices architecture, static thresholds generate massive amounts of alert fatigue. A brief CPU spike might be expected auto-scaling behavior, not an outage. When a real cascading failure occurs, human operators are overwhelmed by a flood of disconnected alerts from 50 different microservices, making it impossible to identify the root cause quickly. Mean Time to Resolution (MTTR) skyrockets.
The Architectural Solution
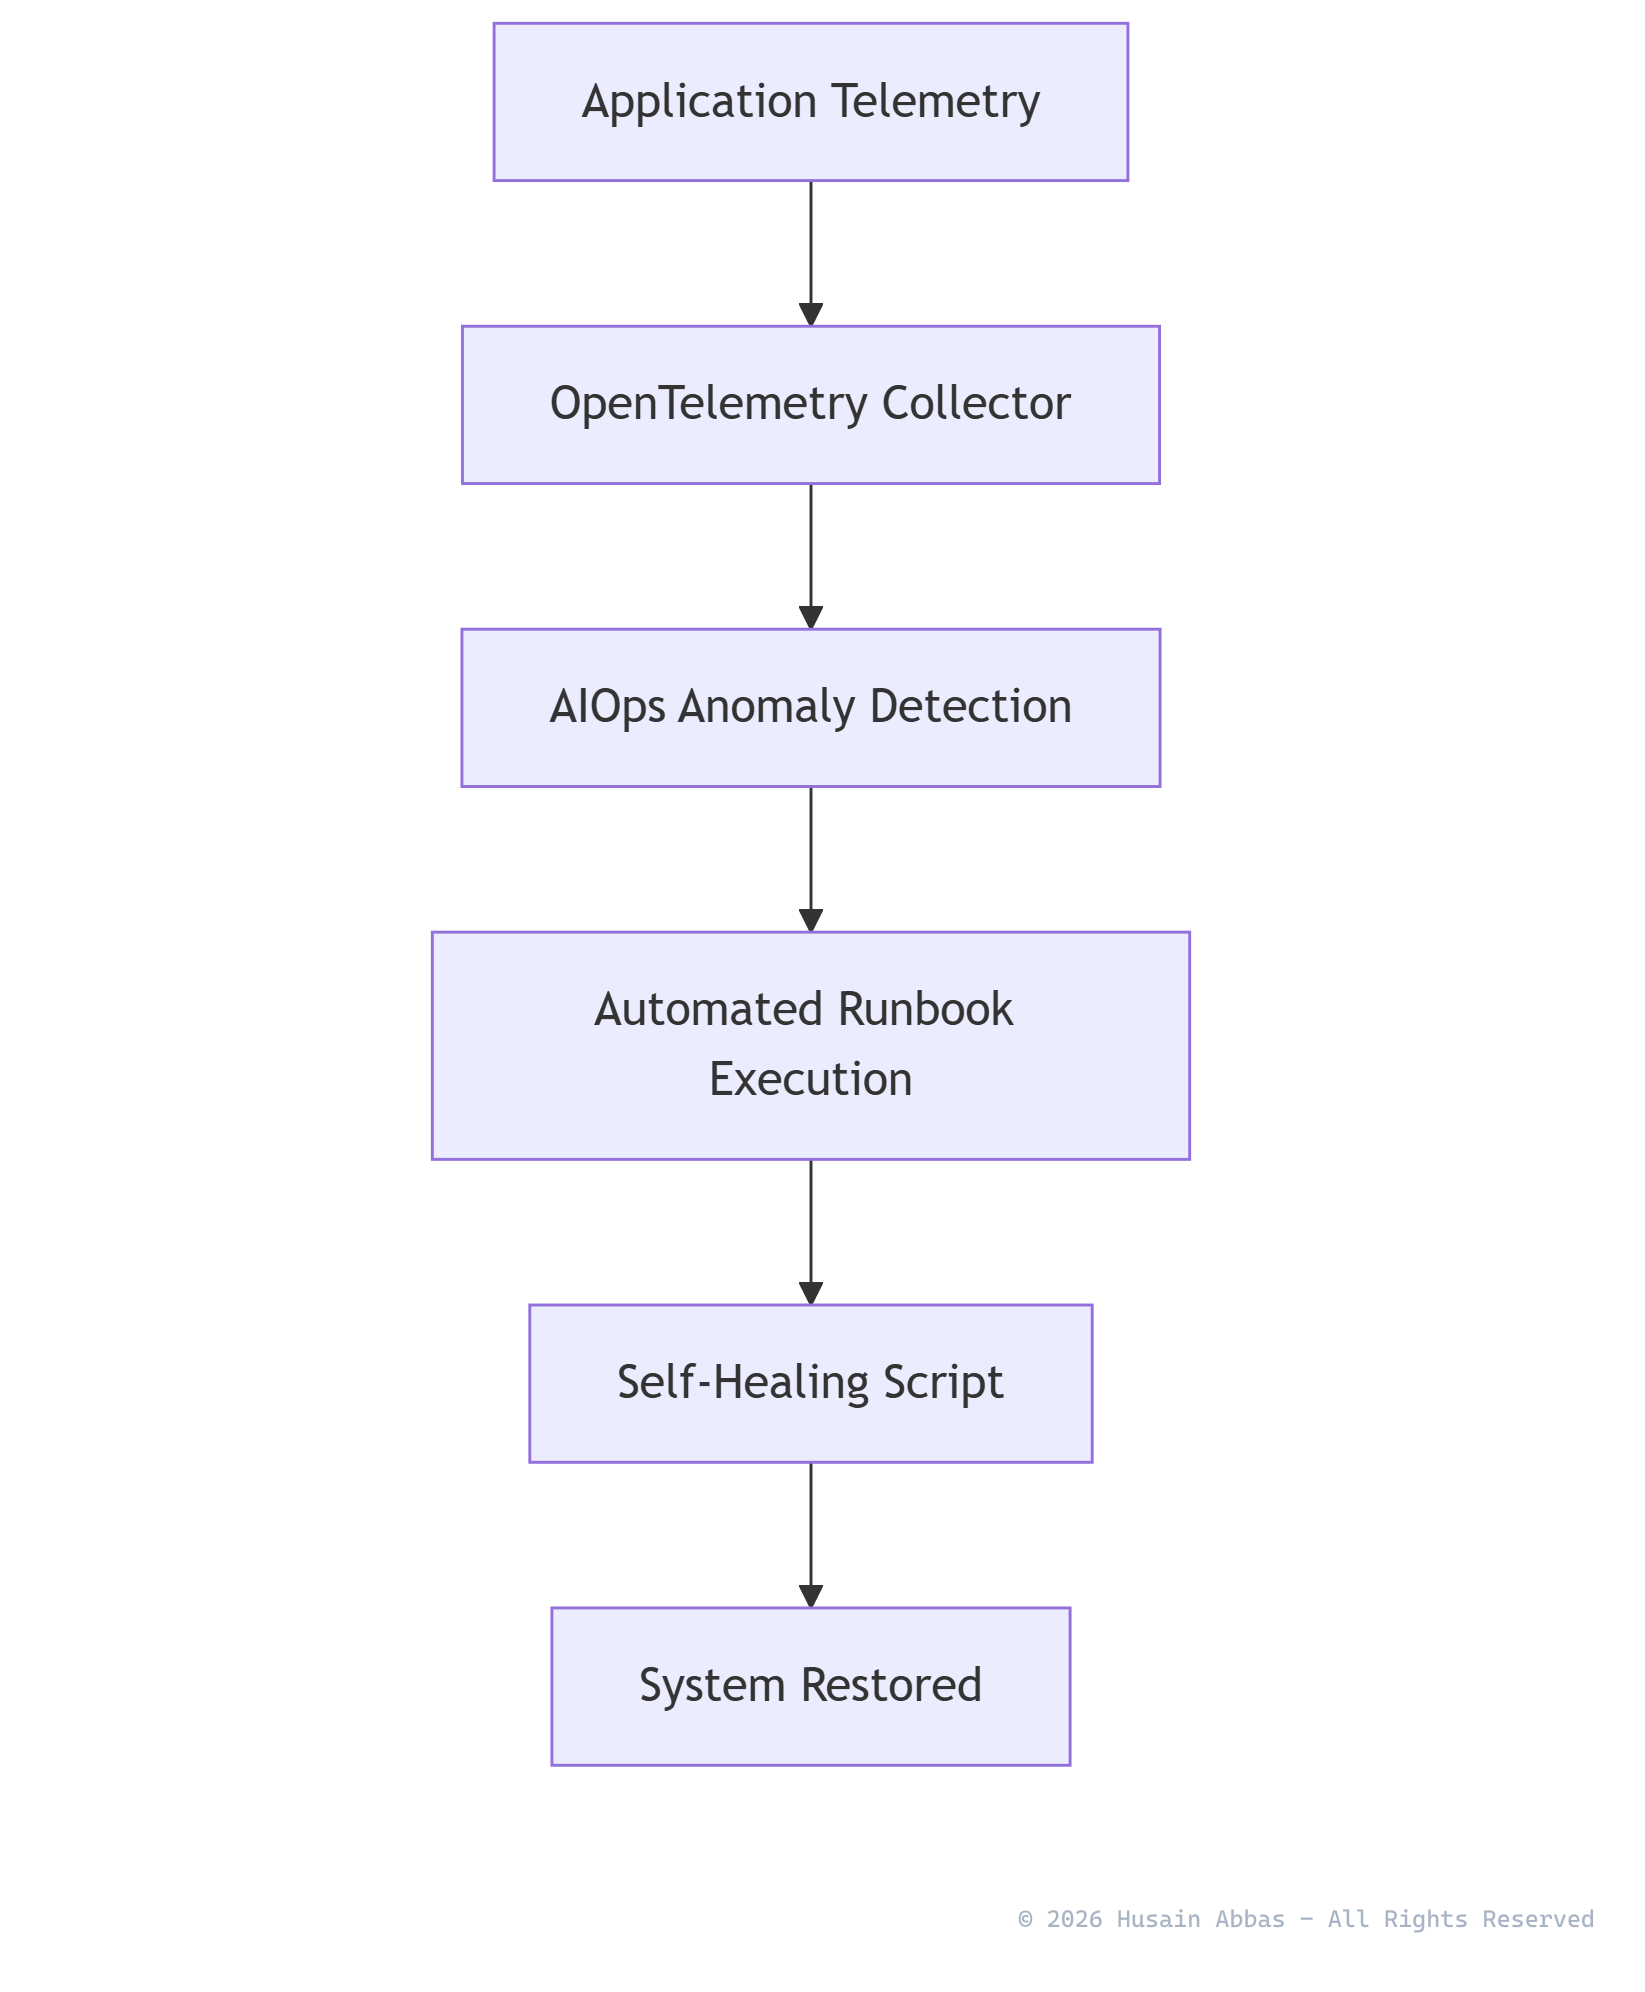
The solution is Telemetry-Driven AIOps—a closed-loop architecture that combines unified observability with machine learning and hyperautomation to achieve “Self-Healing.”
- Unified Telemetry: Instead of siloed monitoring tools, all applications emit standardized data via OpenTelemetry (OTel) to a central data lake.
- Algorithmic Anomaly Detection: Machine learning models baseline normal behavior across millions of metrics. They detect statistical anomalies (e.g., “Checkout latency is 3 standard deviations above normal for a Tuesday at 2 PM”) rather than relying on static thresholds.
- Automated Remediation: When a high-confidence anomaly is detected, an event-driven automation engine (like Ansible or AWS EventBridge) triggers a remediation runbook to fix the issue before a human is even paged.
Core Implementation
The foundation of this architecture is unified instrumentation. If traces, logs, and metrics do not share a common correlation ID, the AIOps engine cannot find the root cause. Below is an example of implementing OpenTelemetry in a Node.js microservice to guarantee cross-boundary context propagation.
// OpenTelemetry Instrumentation (Node.js)
const { NodeTracerProvider } = require('@opentelemetry/sdk-trace-node');
const { autoDetectResources } = require('@opentelemetry/resources');
const { SemanticResourceAttributes } = require('@opentelemetry/semantic-conventions');
const { OTLPTraceExporter } = require('@opentelemetry/exporter-trace-otlp-grpc');
const { BatchSpanProcessor } = require('@opentelemetry/sdk-trace-base');

async function initializeObservability() {
  // Step 1: Automatically detect cloud context (e.g., K8s pod name, AWS region)
  const resource = await autoDetectResources();

  // Step 2: Bind the specific microservice identity to all telemetry
  resource.attributes[SemanticResourceAttributes.SERVICE_NAME] = 'checkout-api';
  resource.attributes[SemanticResourceAttributes.SERVICE_VERSION] = 'v1.4.2';

  const provider = new NodeTracerProvider({ resource });

  // Step 3: Export telemetry to the centralized AIOps engine
  // This allows the ML engine to correlate metrics across the entire enterprise
  const exporter = new OTLPTraceExporter({
    url: 'grpc://otel-collector.observability.svc.cluster.local:4317'
  });

  // Use a Batch processor for high-throughput, low-latency applications
  provider.addSpanProcessor(new BatchSpanProcessor(exporter));
  provider.register();

  console.log('OpenTelemetry successfully initialized. Traces flowing to AIOps engine.');
}
Edge Cases & Limitations
While self-healing systems are the holy grail of SRE, they possess strict limitations:
- The “Remediation Loop” Risk: If a self-healing script is flawed, it can cause more damage than the outage itself. For example, if an AIOps engine incorrectly detects a “zombie process” and aggressively restarts the primary database every 5 minutes, the self-healing system becomes the attacker.
- Model Training Time: Machine learning models require weeks of historical data to accurately baseline “normal” behavior. In highly volatile environments with frequent deployments, the models may generate false positives because “normal” is constantly changing.
- Context Truncation: If a legacy mainframe sits in the middle of a transaction path and does not support OpenTelemetry headers, the trace is broken. The AIOps engine loses end-to-end visibility, reverting back to siloed, manual debugging.
Recommended Industry Reading & References
For further exploration of AIOps, OpenTelemetry, and self-healing systems, consider these authentic resources:
- OpenTelemetry: Official Documentation - The industry standard framework for generating, collecting, and exporting telemetry data.
- Google SRE Book: Site Reliability Engineering - The definitive guide on operating scalable, highly reliable software systems.
- Gartner: Market Guide for AIOps Platforms - Strategic insights on the evolution from reactive monitoring to proactive AIOps.
- CNCF: Observability Whitepaper - Foundational principles for engineering robust observability pipelines.